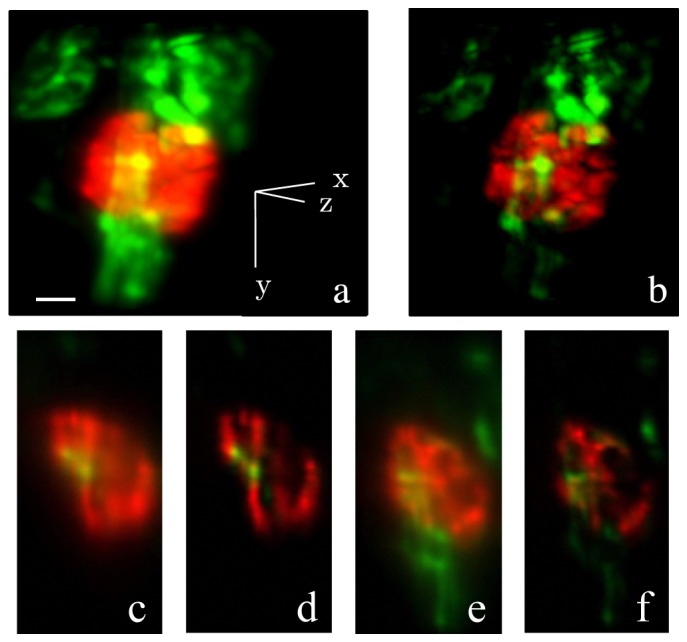
Fig. 10.

3D two-color images of kidney cellular structure of a live double transgenic zebrafish larva at 4dpf. GFP (green) labels endothelial cells in the vasculature. mCherry (red) labels podocytes. (a) Maximum intensity projection of 3D image set taken with a uniform light-sheet (full image set (256 × 256 × 68) in Media 6 (3.1MB, MP4) ); (b) Maximum intensity projection of diffusion-free 3D image set obtained with structured light-sheet (full image set (256 × 256 × 68) in Media 7 (2.9MB, MP4) ); (c) A x-z plane cross section (anterior view) of the 3D image taken with a uniform light-sheet (d) Same cross section as (c), taken with structured light-sheet; (e) A y-z plane cross section (lateral view) of the 3D image taken with a uniform light-sheet; (f) Same cross section as (e), taken with structured light-sheet. The scale bar is 20 μm.
