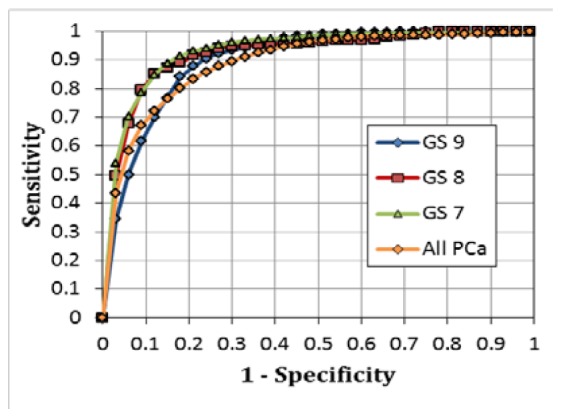
Fig. 5.

ROC curves obtained using the dMOD and the MLR classification for identifying parenchymal PCa tissues at individual PCa grades (GS 9, GS 8, GS 7) using 5-tissue-type classification and with all grades combined (All PCa) using 3-tissue-type classification.
