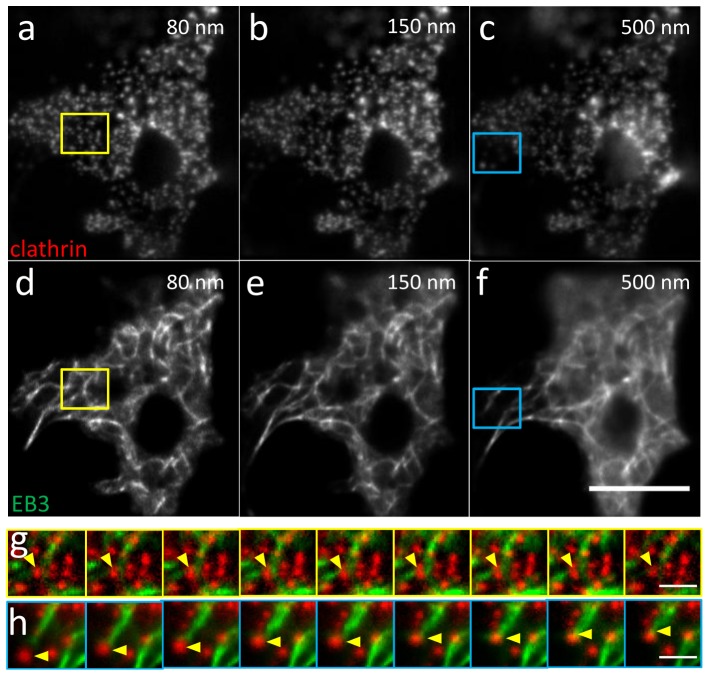
Fig. 5.
Distribution of microtubules and clathrin from 100 nm to 500 nm away from the membrane in a live cell, represented by dual-color images. (a)−(c) EB3 in an INS-1 cell under TIRF illumination with penetration depths of 80 nm (a), 150 nm (b), and 500 nm (c). (d)−(f) Clathrin in the same INS-1 cell with penetration depths of 80 nm (d), 150 nm (e), and 500 nm (f). (g) Time-lapse montage of the enlarged region indicated by the yellow box in (a) and (d). The arrows show a CCP that co-localized with a microtubule filament and remained stationary during the time of recording. (h) Time-lapse montage of the enlarged region indicated by the blue box in (c) and (f). The arrows show a CCV that co-localized with a microtubule filament and moved along the filament during the time of recording. Scale bar in (a)−(f) represents 10 μm, whereas that in (g)−(h) represent 1 μm. Each image in the sequence in (g) and (h) is separated by 6 s from the preceding image. Red: clathrin, Green: EB3.

