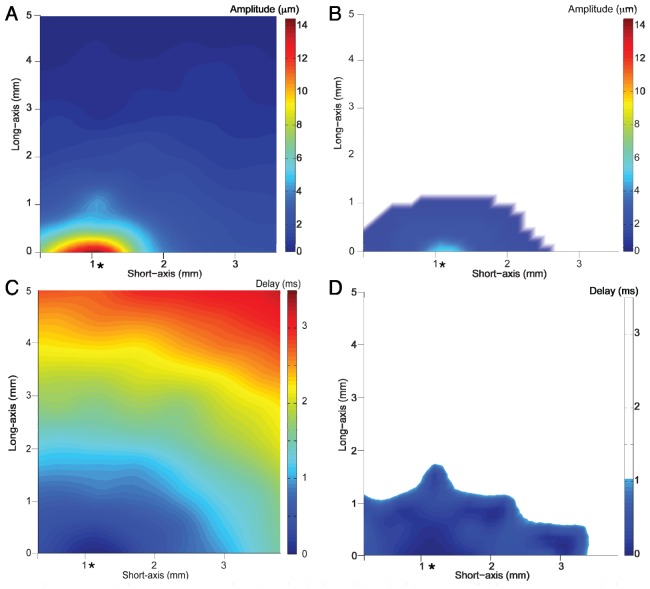
Fig. 2.
Corneal tissue response to air pulse stimulation with and without cross-linking treatment. Symbol (*) indicates the approximate location of tissue stimulation. Surface wave amplitude in untreated corneal tissue (A) and after UV cross-linking (B); corneal surface wave amplitude was reduced in treated tissue and could not be measured beyond ~1 mm. Temporal delay observed between tissue surface stimulation and observed surface displacement. Surface wave propagation speed was slower in un-treated tissue as indicated by greater delay times shown by red-shifted colors (C) when compared to tissue after UV cross-linking (D). Note that the time-delay color scales (panels C and D) are the same, but truncated in D where it was not possible to observe surface waves. Lower surface wave amplitude and faster propagation speeds (shorter delay times) are consistent with higher material stiffness.

