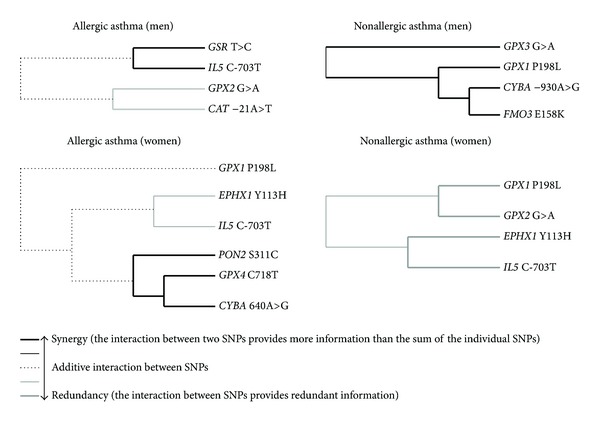
Figure 3.

Dendrograms of gene-gene interactions in the pathogenetic variants of asthma (MDR method). Dendrograms show both complexity and diversity of interactions between polymorphic genes of antioxidant defense enzymes in allergic and nonallergic asthma (dendrograms are stratified by gender). Each dendrogram comprises a spectrum of lines representing a continuum from synergy (black) to redundancy (gray) of gene-gene interactions. The lines range from bold black, representing a high degree of synergy (positive information gain), thin black, representing a lesser degree, and dotted line representing the midway point between synergy and redundancy. On the redundancy end of the spectrum, the highest degree is represented by bold gray (negative information gain) with a lesser degree represented by thin gray.
