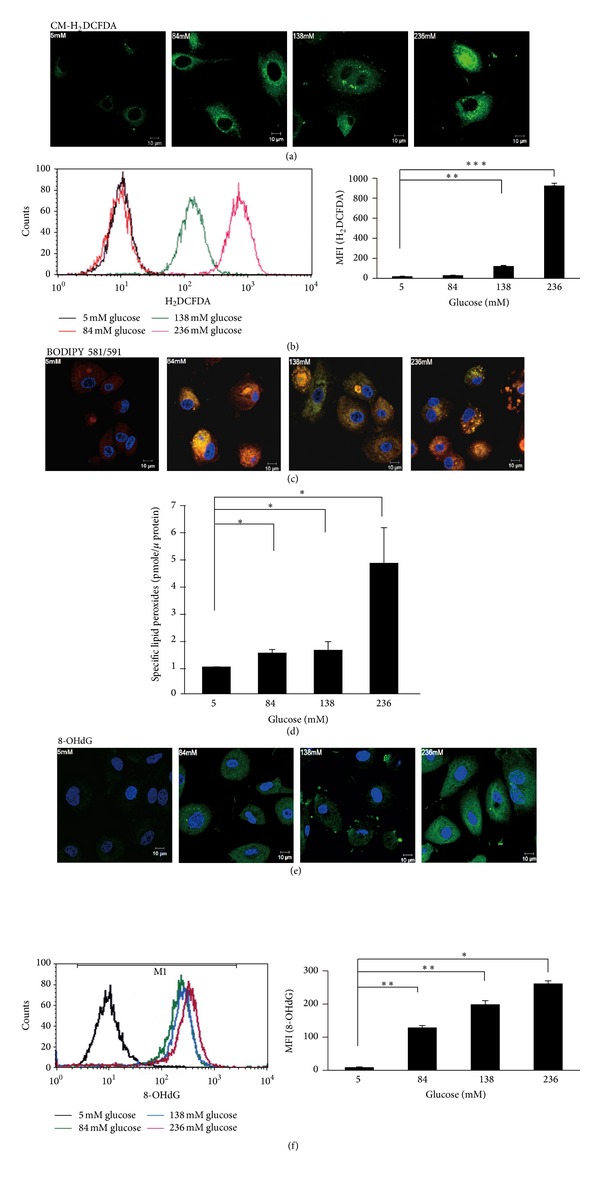
Figure 2.

High-dialysate-glucose-induced ROS generation and oxidative damage in HPMCs. (a) To detect ROS generation, CM-H2DCFDA staining (green) was performed on the glucose-treated HPMCs. (b) The levels of ROS generation were analyzed using flow cytometry. Exposure to high glucose resulted in a dose-dependent increase in ROS generation. (c) Lipid peroxides were visualized using C11-BODIPY581/591 fluorescent staining. After reaction with ROS or free radicals, the red fluorescence of this fluorophore shifted to green. An enhanced green fluorescence intensity was observed in the HPMCs treated with 236 mM glucose. (d) Lipid peroxides were evaluated as TBA-reacted MDA using a HPLC-fluorospectrophotometry method. (e) By staining with an anti-8-OHdG antibody conjugated with FITC, the accumulation and localization of 8-OH-dG were visualized through confocal imaging. Strong green fluorescent images were observed in the mitochondria of the high-glucose-treated HPMCs. (f) The level of 8-OH-dG was measured using flow cytometry analysis. Plots represent the mean ± SD from 4 independent experiments. Statistical significance: *P < 0.05 and **P < 0.01 compared with the control.
