
Figure 5.
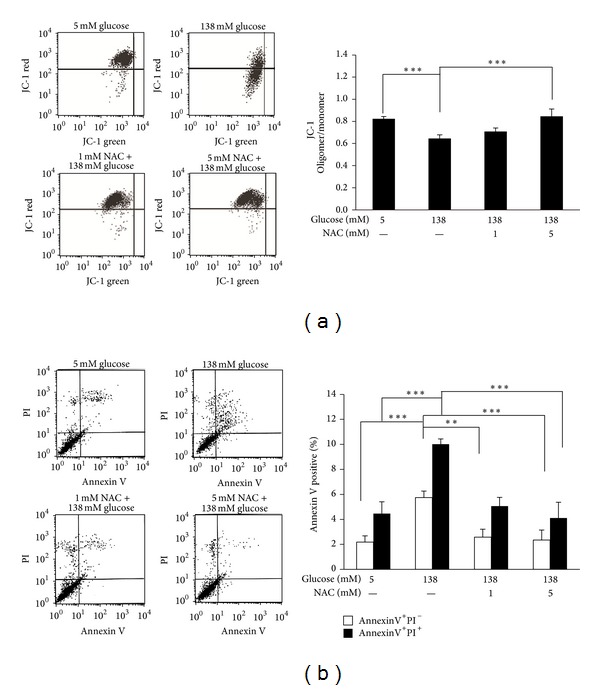
NAC attenuated high-dialysate-glucose-induced mitochondrial dysfunction and apoptosis. (a) A dot plot of mitochondrial membrane potential determined using flow cytometry is shown in 4 groups (5 mM glucose, 138 mM glucose, 1 mM NAC with 138 mM glucose, and 5 mM NAC with 138 mM glucose). The mitochondrial membrane was stained with JC-1, existing as a green fluorescent monomer at low membrane potentials and as orange fluorescent aggregates at high membrane potentials. (b) Histograms represent the JC-1-oligomer oligomer/monomer (green) fluorescence ratio. (c) A dot plot of cell apoptosis determined using flow cytometry is shown. The 4 groups were obtained and the relative percentages of cells at the various apoptotic stages are presented. The lower-left field indicates viable cells, the lower-right field indicates early apoptotic cells (annexin V positive and PI negative), and the upper-right field indicates late apoptotic cells (annexin V positive and PI positive). (b) Flow data are presented for 3 experiments, in which apoptosis was induced through high-dialysate glucose stimulation. Pretreatment of NAC reduced high-dialysate-glucose-induced apoptosis.