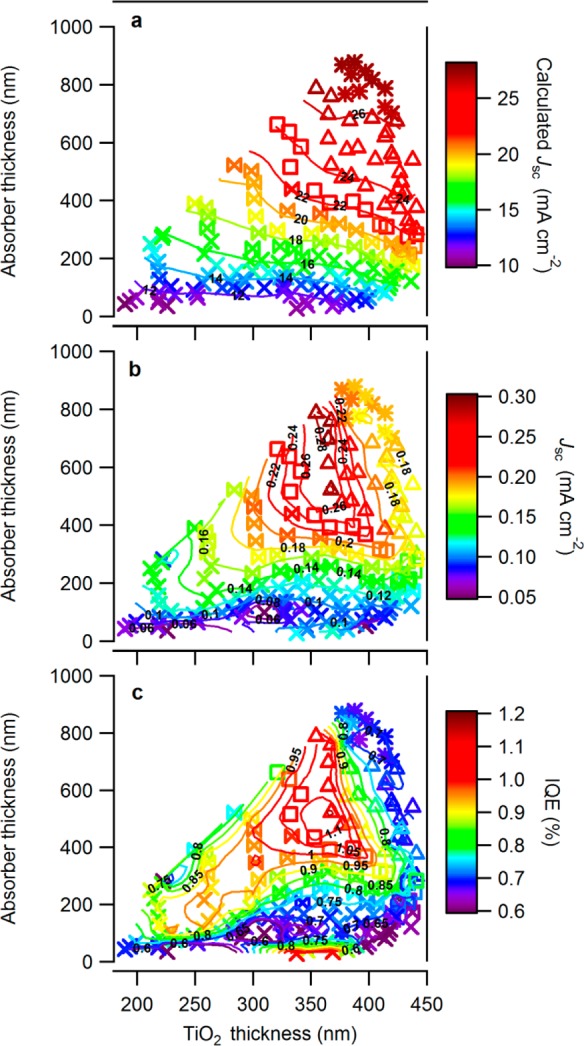
Figure 11.

(a) Plot of maximum theoretical short circuit photocurrent (Jcalcd) as a function of TiO2 and Cu–O layer thicknesses. (b) Plot of short circuit photocurrent (Jsc) as a function of layer thicknesses. (c) Plot of calculated internal quantum efficiency (IQE) as a function of layer thicknesses. The symbols represent the bandgap/composition groups, showing that cells containing high levels of Cu4O3 (□ and Δ) have relatively enhanced IQE, whereas cells containing CuO have degraded IQE, and cells with Cu2O shows enhanced IQE only for specific cells.
