
Figure 9.
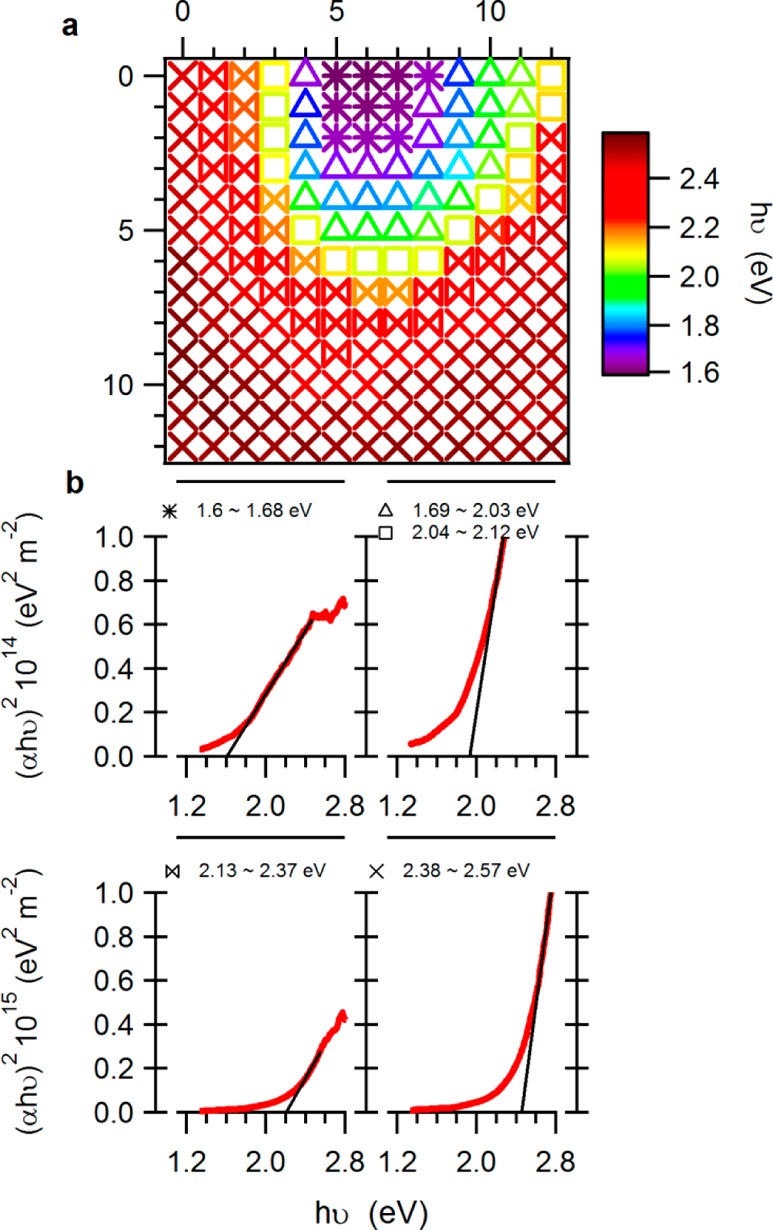
(a) Plot of fitted (direct) apparent bandgaps as a function of cell position, showing narrower bandgaps in the center of deposition, wider bandgaps in the periphery, and a gradual change in between. The bandgaps were calculated from absorptance spectra and the thickness of the absorber for each cell. The symbols of the cells are used to represent the partition of the library into five clusters of cells, having a bandgap in a specific range as shown in panel b. (b) Examples of bandgap fits taken from cells that represent clusters that have a common bandgap, showing also a variation in the absorption coefficient. The range of bandgaps and the representative symbol are shown on top of each example.