
Figure 1.
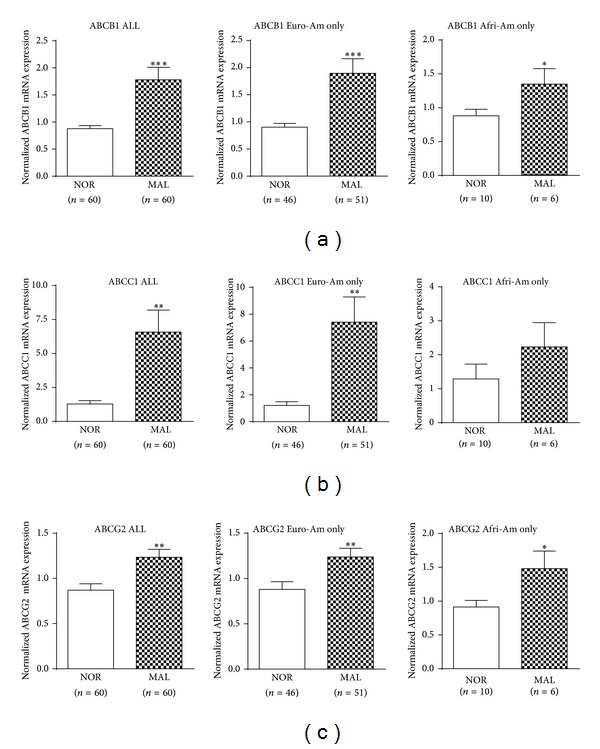
Comparison of ABCB1, ABCC1, and ABCG2 gene expression in normal and pancreatic cancerous tissue. The individual expression levels of the indicated ABC transporters (a–c) were analyzed by real-time qRT-PCR, normalized to mRNA expression of PMM1, and reported as x-fold relative to the expression of a calibrator (a premixed pancreatic RNA sample, set as 1). Values are expressed as means ± SEM, *P < 0.05, **P < 0.01, and ***P < 0.001. Euro-Am, European Americans; Afri-Am, African Americans.