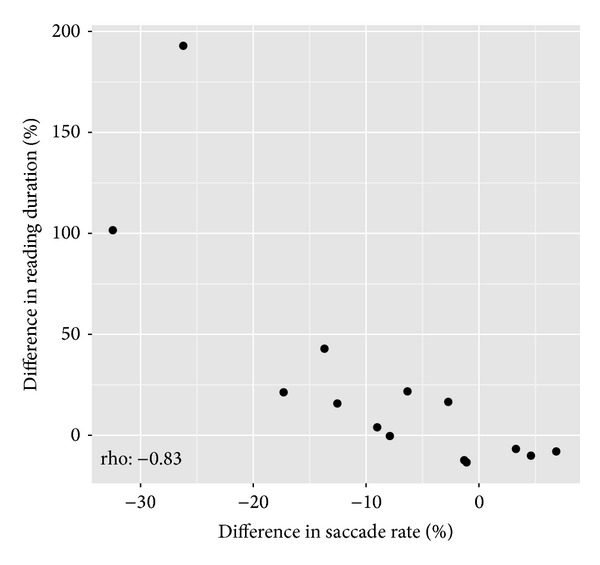
Figure 3.

Scatterplots depicting the statistically significant relationships between the percentage difference in reading duration between the worse eye and the better eye and the percentage difference in saccade rate between the worse eye and the better eye.
