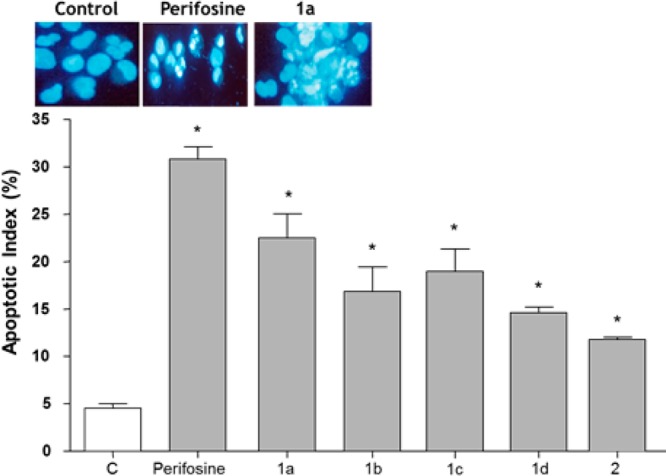
Figure 3.

Percentage of A549 cells with damaged DNA after exposure to test compounds and the Akt inhibitor perifosine. Upper panels, morphological appearance of control and treated cells. Data were expressed as mean values ± SD (n = 3). *P < 0.05, as compared with control.
