
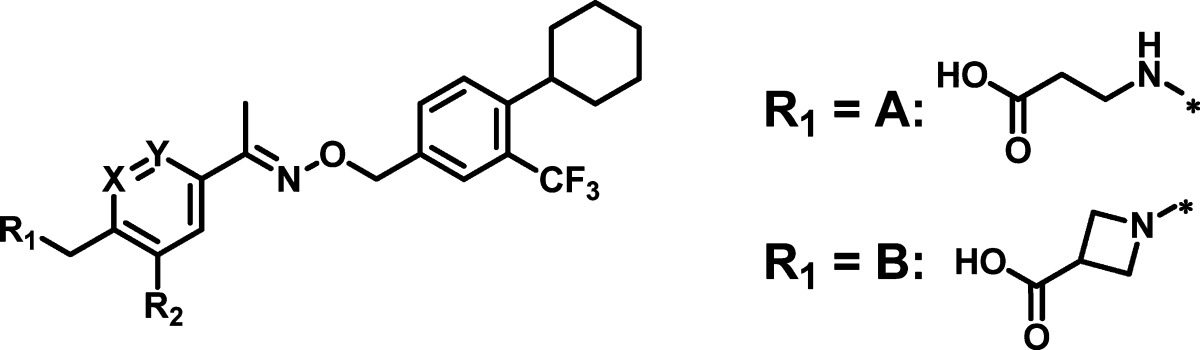
Table 3. Structure–Activity Relationship of the Head Groups.
| EC50 (μM)a |
|||||
|---|---|---|---|---|---|
| compd | R1 | R2 | X=Y | S1P1 | S1P3 |
| 21 | A | H | N=CH | 0.0026 (86) | 4.3 (44) |
| 22 | A | H | CH=N | 0.0014 (92) | 2.6 (53) |
| 23 | A | H | S | 0.0022 (104) | 4.0 (79) |
| 24 | A | H | O | 0.017 (100) | 2.5 (62) |
| 25 | A | F | CH=CH | 0.0003 (105) | 2.2 (61) |
| 26 | A | Cl | CH=CH | 0.0006 (106) | 1.9 (50) |
| 27 | A | Br | CH=CH | 0.0004 (85) | 1.1 (65) |
| 28 | A | Me | CH=CH | 0.002 (94) | 5.9 (159) |
| 29 | A | Et | CH=CH | 0.0007 (92) | 7.2 (43) |
| 30 | A | cyclo-Pr | CH=CH | 0.0004 (98) | 1.3 (63) |
| 31 | B | Me | CH=CH | 0.0016 (80) | 3.2 (127) |
| 32 | B | Et | CH=CH | 0.0004 (91) | 5.0 (55) |
a
GTPγS binding assay (see ref (12) for detailed assay descriptions); values in parentheses represent the Emax, % of agonism at 10 μM as compared to S1P.