
Figure 2.
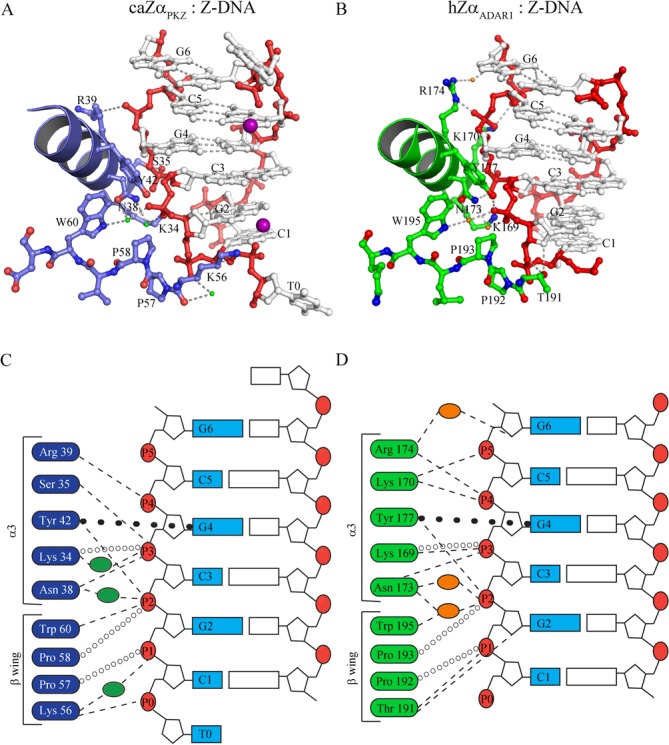
The Z-DNA binding modes of caZαPKZ and hZαADAR1. (A) The binding interface between caZαPKZ and Z-DNA. The DNA binding interface of protein is depicted as a blue ribbon and ball-and-stick models. The residues involved in Z-DNA binding are labeled. The backbone and bases of DNA are drawn as red and gray ball-and-stick models. The manganese atoms are represented by magenta spheres. The water molecules are represented by green dots. (B) The Z-DNA binding interface of hZαADAR1. The DNA binding interface of protein is depicted by a green ribbon and ball-and-stick models. The residues involved in Z-DNA binding are labeled. The backbone and bases of DNA are drawn as red and gray ball-and-stick models. The water molecules are represented by orange dots. The schematic drawings of the DNA binding interfaces of caZαPKZ (C) and hZαADAR1 (D) with Z-DNA. The interaction residues of caZαPKZ and hZαADAR1 are represented in blue (C) and green boxes (D), respectively. The phosphate backbones are numbered from P0 to P5 in red circles. Hydrogen bonds, hydrophobic interactions and π–π interaction are represented by dashed lines, open circles and closed circles, respectively. Green (C) and orange (D) ovals stand for water molecules in the caZαPKZ and hZαADAR1 structures, respectively.