
Figure 3.
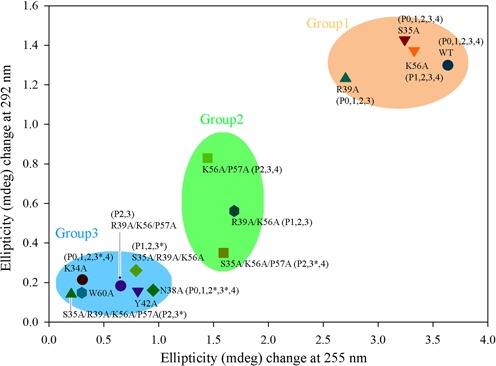
B-to-Z transition induced by caZαPKZ mutants. The Y-axis and X-axis display the ellipticity (mdeg) difference during B-to-Z transition at 292 nm and 255 nm, respectively. The wild-type, K34A, S35A, N38A, R39A, Y42A, K56A, W60A, R39A/K56A, S35A/R39A/K56A, K56A/P57A, S35A/K56A/P57A, R39A/K56A/P57A and S35A/R39A/K56A/P57A mutants of caZαPKZ were tested at a [P]/[N] ratio of 4. The plots are clustered in three groups by using k-means clustering algorithm. The names of phosphate groups inside of parentheses indicate the possible interaction between the residues in the mutants and the backbone phosphates. An asterisk indicates the phosphate groups that lose one of their residue interactions by mutation. In this case, their interactions with proteins partially remain.