
Figure 4.
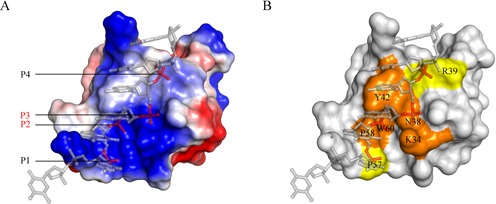
The Z-DNA binding surface of caZαPKZ. (A) Electrostatic distribution of caZαPKZ. Positively charged, negatively charged and hydrophobic regions are depicted in blue, red and white, respectively. P2 and P3 are labeled in red, and P1 and P4 are in black. (B) The Z-DNA binding surface of caZαPKZ. Key residues involved in P2 and P3 binding are colored orange, and P1 or P4 binding residues are shown in yellow.