
Figure 5.
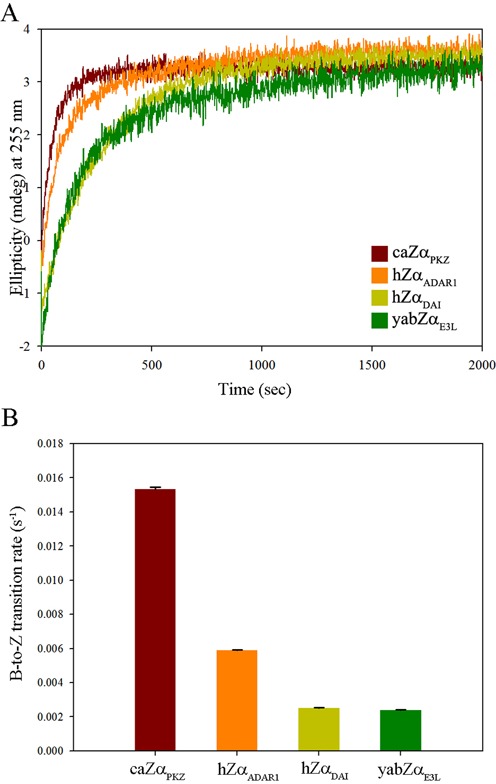
B-to-Z transition kinetics of Zα domains. (A) CD spectra of 15 μM of ds-(dCdG)6 were monitored at 255 nm in the presence of caZαPKZ (brown), hZαADAR1 (orange), hZαDAI (yellow) and yabZαE3L (green). (B) The calculated B-to-Z transition rates (s−1) with error bars from caZαPKZ (brown), hZαADAR1 (orange), hZαDAI (yellow) and yabZαE3L (green).