
Figure 6.
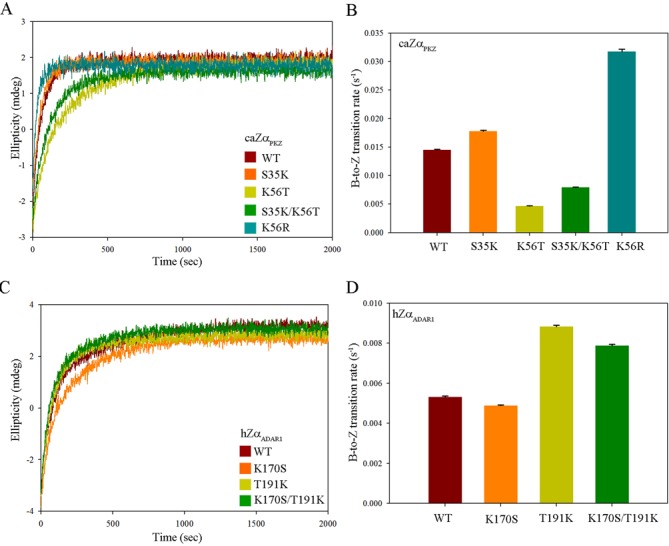
B-to-Z transition activity of caZαPKZ and hZαADAR1. (A) Time course CD spectra of caZαPKZ and S35K, K56T, K56R and S35K/K56T mutants. (B) The calculated B-to-Z transition rates (s−1) of the wild-type, S35K, K56T, S35K/K56T and K56R caZαPKZ are represented by brown, orange, lime, green and turquoise colors, respectively. (C) Time course CD spectra of hZαADAR1 and K170S, T191K and K170S/T191K mutants. (D) The calculated B-to-Z transition rates (s−1) of the wild-type, K170S, T191K and K170S/T191K mutant hZαADAR1 are represented by brown, orange, lime and green colors, respectively.