
Figure 7.
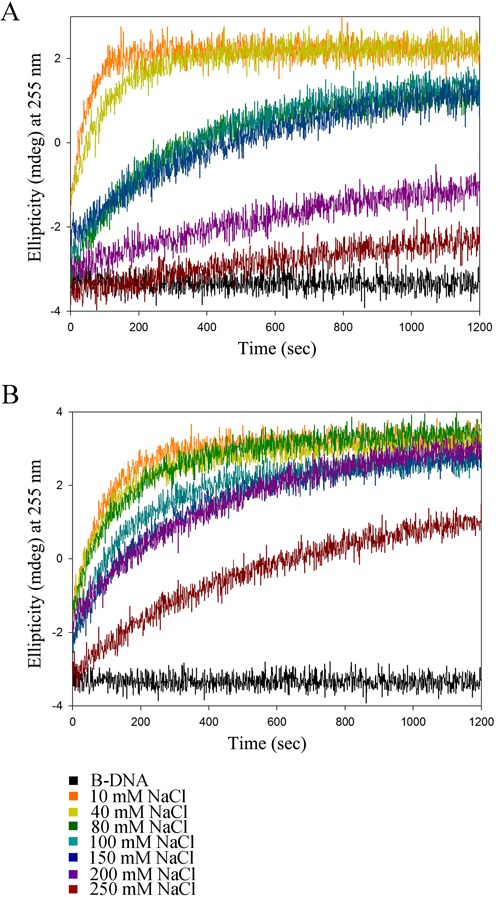
Salt effect on the B-to-Z transition. (A) Time course CD spectra of Z-DNA:caZαPKZ in various NaCl concentrations (10, 40, 80, 100, 150, 200 and 250 mM). The ellipticities (mdeg) monitored at 255 nm are indicated by different colors. (B) Time course CD spectra of Z-DNA:hZαADAR1 in the same conditions with the same color schemes as in Figure 7A.