
Figure 2.
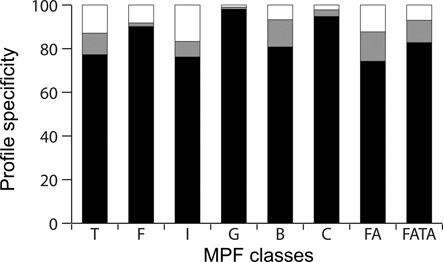
Specificity of the profiles obtained for the different mating-pair formation (MPF) classes named I, C, G, T, F, B, FATA and FA (see text for details). Black corresponds to the percentage of hits found within −20/+20 genes around a virB4 of the corresponding class. Gray corresponds to the percentage of proteins found within −20/+20 genes neighborhood of a virB4 of another class. White corresponds to the percentage of proteins that were not found to be associated with a VirB4.