
Figure 3.
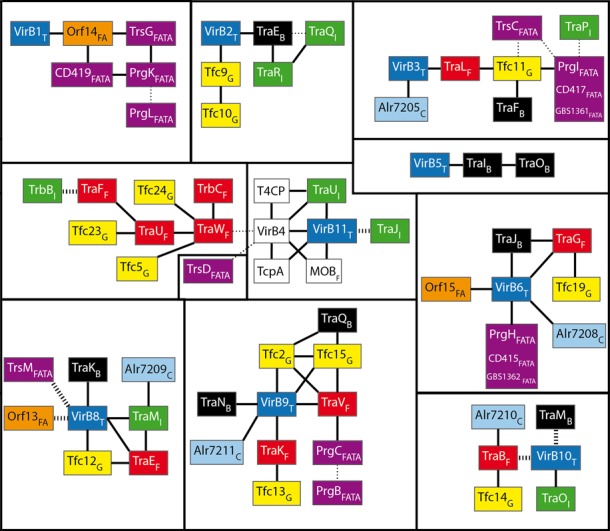
Relationships of homology between protein families of different mating-pair formation (MPF) classes. Subscript letters correspond to the I, C, G, T, F, B, FATA and FA MPF classes (see text for details). Black lines represent direct relationships, i.e. an HHsearch P-value < 0.001. Dotted wide lines correspond to relationships that have been established by structure or sequence similarity, but not by profile alignment. Dotted thin lines represent less certain relationships given by profile alignments: the HHsearch score suggests a relation of homology, but the two proteins exhibit different features (e.g., domain organization, protein length or presence of specific motifs). White squares represent profiles matching many classes (e.g. VirB4). The color scheme used for the boxes correspond to the MPF classes: blue for MPFT, red for MPFF, green for MPFI, yellow for MPFG, cyan for MPFC, black for MPFB, orange for MPFFA and purple for MPFFATA.