
Figure 4.
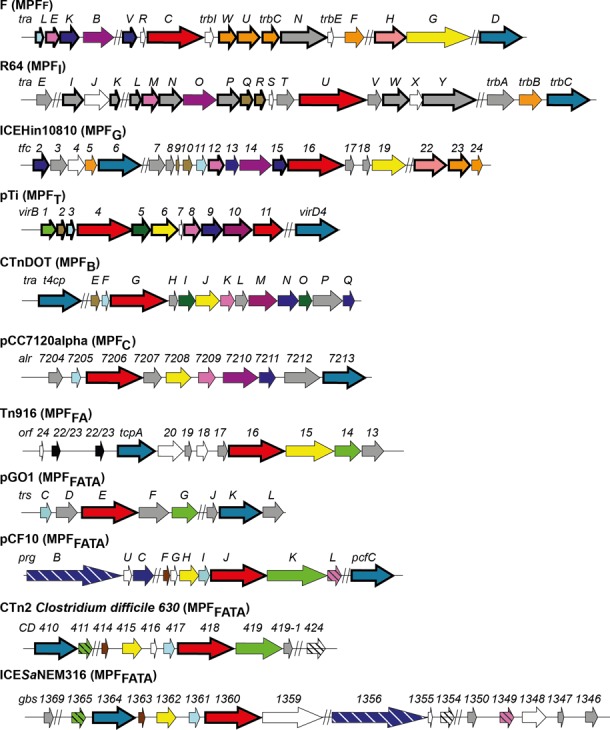
Representation of the different mating-pair formation (MPF) classes. The length of the arrows is proportional to the mean length of the corresponding genes. Bold arrows represent genes for which the corresponding protein profile was already available (6,8,11). White arrows represent genes for which we did not obtain a profile. Gray arrows represent genes for which we built a protein profile lacking homologs in other classes. A given color (except white and gray) corresponds to a single family of homologs.