
Figure 6.
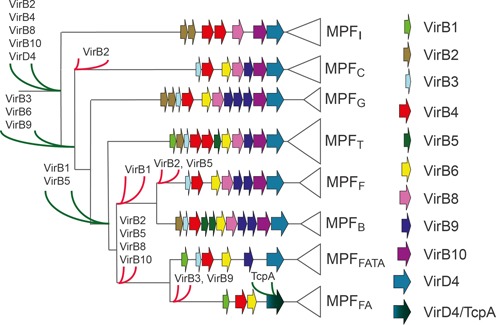
Representation of the presence/absence of the most-conserved protein families along the VirB4 phylogeny as presented in Figure 1 and in (11). Green shapes represent inferred protein gains, whereas red shapes represent protein losses. The colors of the arrows (as shown on the right) correspond to those in Figure 4. The bicolor VirD4/TcpA arrow means that some MPFFA systems use VirD4 as coupling protein, whereas others use TcpA.