
Figure 2.
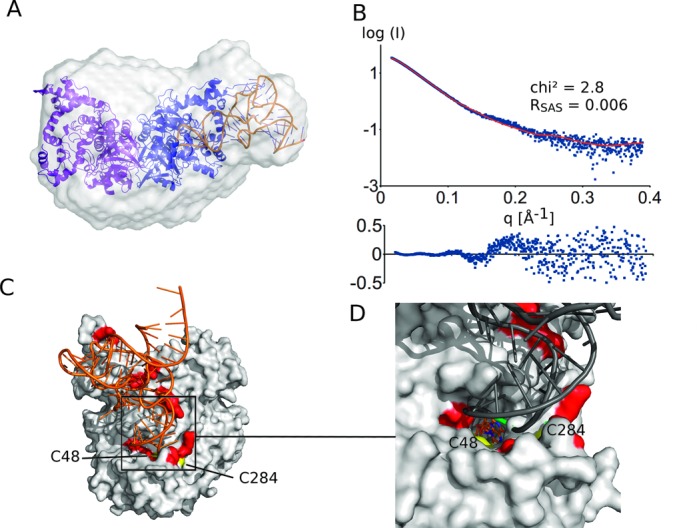
(A) Docking model of the A. aeolicus MnmG–tRNA complex superposed on the ab initio shape as obtained by Dammif. (B) The fit of the theoretical (red) to the experimental (blue) scattering curve supports the model. The residuals of the fits are also shown. (C) Details of the preferred model of the MnmG–tRNA interaction (compare to an alternative model in Supplementary Figure S5) and (D) a close-up view of the (FAD-binding) active site. This model is supported by the proximity of known tRNA-interacting residues (red) (28) and the catalytic cysteines (C48 and C284; yellow) and by the location of the FAD co-factor (shown as a stick model) with respect to the tRNA wobble nucleotide (green).