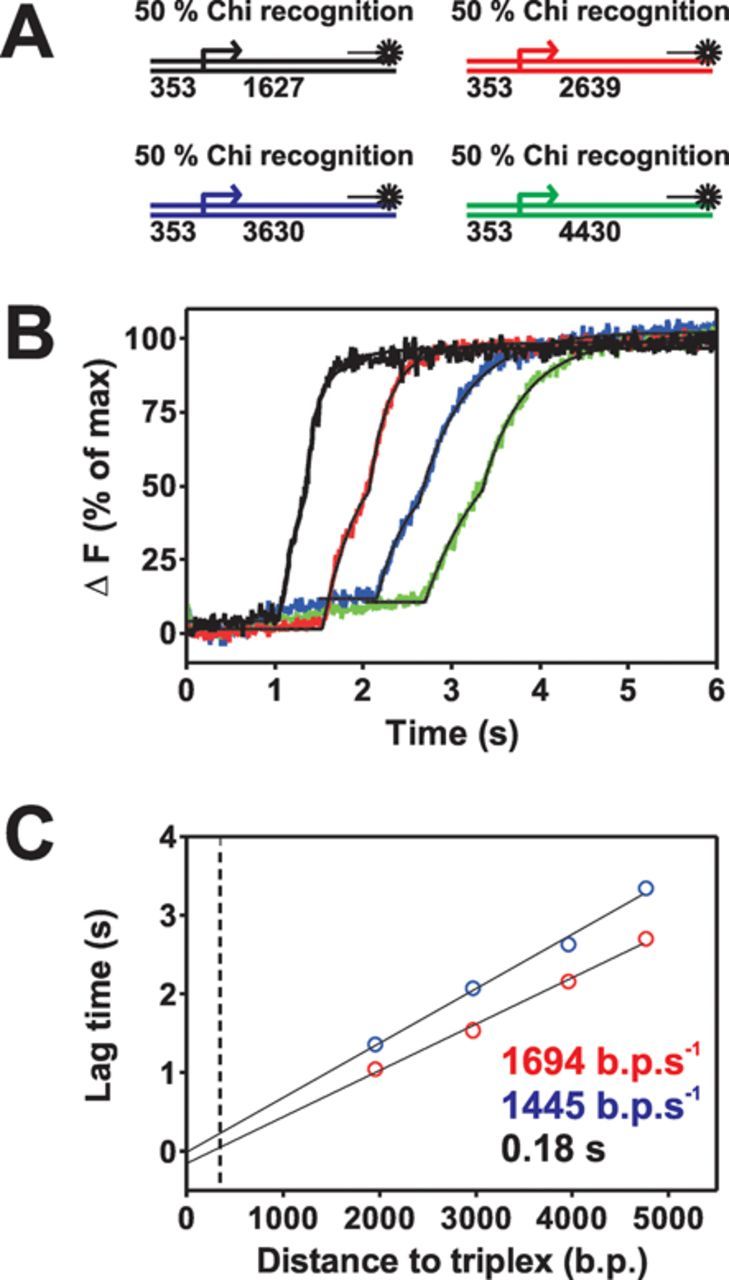
Figure 4.

The translocation rate of AddAB decreases following Chi recognition. (A) Schematic of substrates used in this experiment. (B) Triplex displacement with wild-type AddAB on Chi-containing DNA with variable distances between Chi and the triplex binding site. The distances and colour coding are identical to those in substrates used for modelling (Supplementary Figure S3). DNA molecules (2 nM) blocked on one end by a biotin:streptavidin complex were prebound by AddAB enzymes (10 nM) for 2 min at 37°C before mixing against an equal volume of ATP (1 mM) and AddAK36AB (200 nM). Data are the average of at least three transients and normalized to the fluorescence endpoint. Black lines indicate fits to the data using Equation (1). The blue and green traces are only fit from 1.5 and 2 s onwards, respectively (see the main text for discussion). (C) Plot of the the first and second phase lag times, T1 (red) and T2 (blue) as a function of DNA length. Linear fits to these data yield values for the pre- and post-Chi translocation rate. The black dotted line is the position of the Chi locus.
