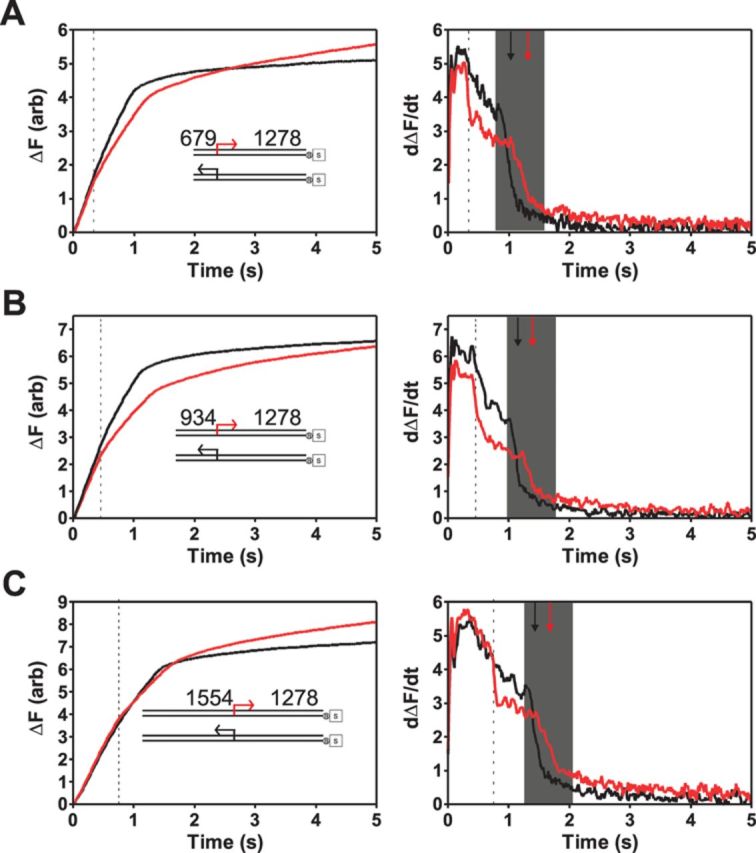
Figure 6.

Chi recognition results in a sustained decrease in ATPase rate. (A)–(C) Left panels: single turnover phosphate release experiments performed on DNA substrates (inset) with a 10X Chi locus in either the correct (red) or incorrect orientation (black) for recognition. The distance between the free DNA end and Chi is indicated, and is different in each of the three pairs of substrates. DNA substrates (0.2 nM) were pre-incubated with AddAB enzymes (2 nM) for 2 min at 37°C before mixing against an equal volume of ATP (1 mM) and heparin (1 mg ml−1). Right panels: first derivative (i.e. the ATPase rate) of the data shown in the left panel. The data have been smoothed by averaging 13 neighbouring points. The grey shaded box indicates the region over which rapid ATPase activity terminates. The black and red arrows indicate the midpoint of these transtions for ‘reverse’ and ‘forward’ substrates, respectively. The black dotted lines show the predicted time (based on data in Figure 5C) for the arrival of AddAB at the Chi locus.
