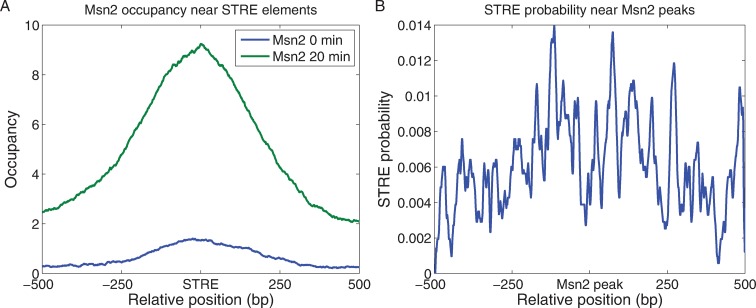
Figure 2.
Msn2 binds near STREs. (A) The average Msn2 occupancy at a particular site is plotted as a function of distance of that site from each of the 3150 promoter STREs (RGGGG motifs), before and 20 min after a glucose-to-glycerol downshift. (B) The likelihood of an STRE residing at a particular site is plotted as a function of distance of that site from each of the peaks of Msn2 binding identified in this study and listed in Supplementary Table S1. The values are calculated as the fraction of Msn2 peaks that contain an STRE at the indicated position, averaged over a 20 bp moving window. By comparison, the probability of finding STRE at a random site is less than 9 × 10⁻⁴.

