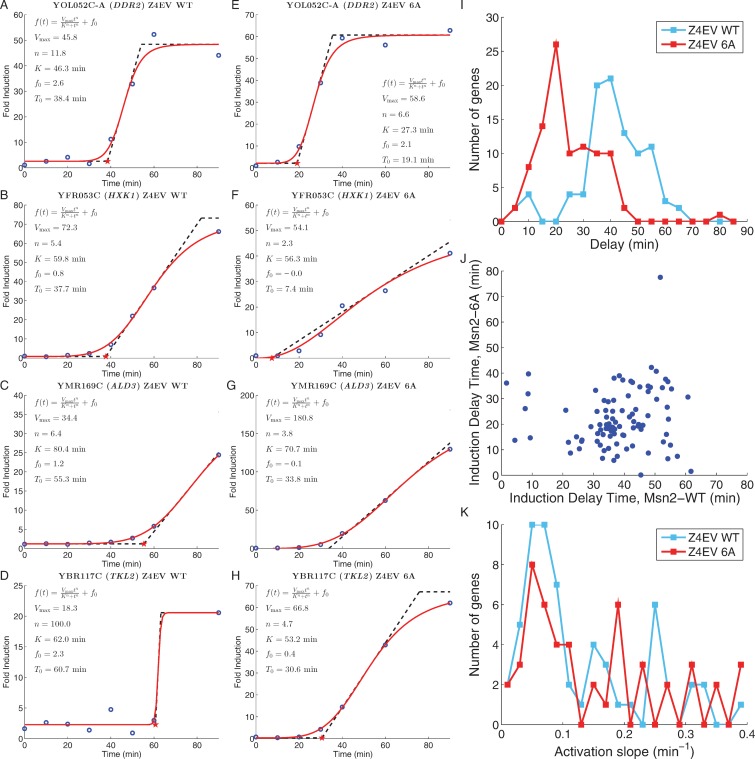
Figure 3.
Different genes exhibit different induction kinetics in response to Msn2. (A–D) Induction kinetics for four Msn2-inducible genes following estradiol addition to strains containing wild-type MSN2 under control of the hybrid Z4EV transcription factor. Blue circles: fold increase in gene transcript levels relative to that immediately prior to estradiol addition; solid red line: best fit of the data for each gene to the function f(t) = f0 + Vmax · tn/(Kn + tn); dashed line: tangent line to the curve at f(t) = Vmax/2, whose extrapolation to the x-axis provides the measure of the time delay in response to Msn2 induction. (E–H) Induction kinetics for the genes shown in (A–D) following estradiol addition to strains containing MSN26A under control of the hybrid Z4EV transcription factor. (I) Histogram of time delay values for the 96 genes induced more than 2-fold in both the MSN2 wild-type and MSN26A strains and whose induction values are reasonably fit by the Hill curve. Blue line: delay values in the MSN2 wild-type strain; red line: delay values in the MSN26A mutant strain. (J) Scatter plot of the delay time for each gene in I in the MSN26A strain relative to that in the MSN2 wild-type strain. (K) Histogram of rates of induction, i.e. the slope of the tangent line to the fitted curve at f(t) = Vmax/2, for the 96 genes in (I). Blue line: delay values in the MSN2 wild-type strain; red line: delay values in the MSN26A mutant strain.

