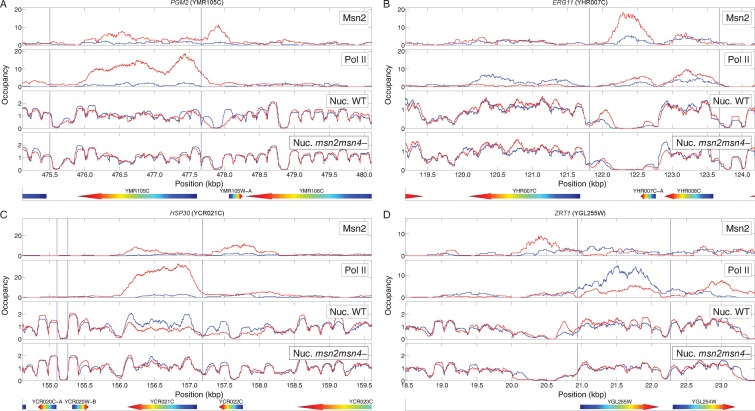
Figure 4.
Msn2 promotes nucleosome repositioning over gene promoters. Shown are binding profiles of Msn2 (row 1) and PolII (row 2) as well as the nucleosome profiles (rows 3 and 4) over four different Msn2-regulated genes and the surrounding regions along the genome. Each panel shows a binding profile before the glucose-to-glycerol switch (blue lines) and 20 min after the transition (red lines). The nucleosome profiles were obtained for both an MSN2 MSN4 (row 3) and an msn2 msn4 strain (row 4). Two of the genes, PGM2 and HSP30, are induced by Msn2 following the nutrient downshift, while the other two, ERG11 and ZRT1, are repressed. In order to be able to compare the occupancy profiles obtained from different experiments with different sequencing coverage, we normalized all profiles such that the average occupancy across each chromosome in each experiment equals 1.

