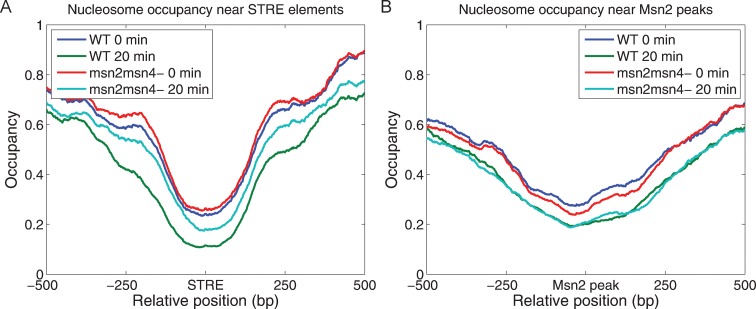
Figure 5.
Msn2 reduces the average nucleosome occupancy near its binding sites following nutrient downshift. The distribution of nucleosome occupancy around STREs (A) and Msn2 binding sites (B), as defined in the legend to Figure 2, are shown before (blue line) and after (green line) the glucose-to-glycerol downshift in wild-type cells and before (red line) and after (cyan line) the glucose-to-glycerol downshift in msn2 msn4 mutant cells.

