Figure 6.
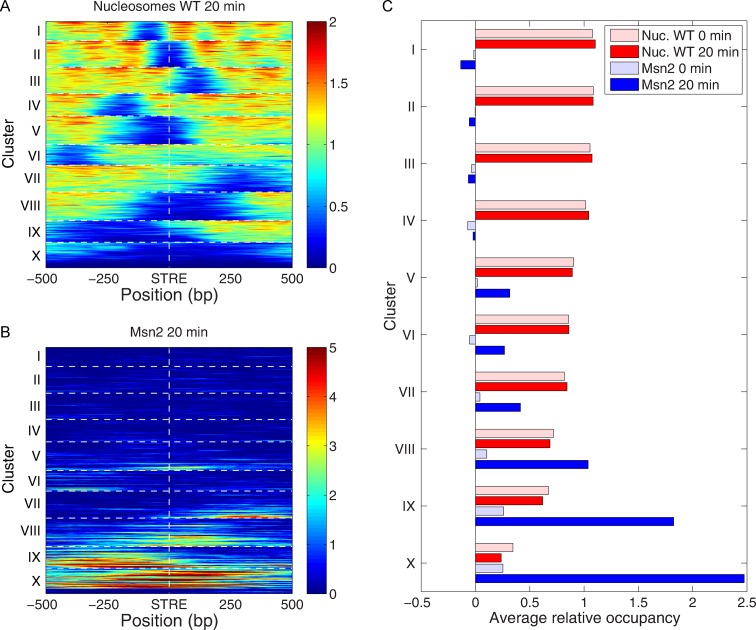
Msn2 binds to STREs in nucleosome free promoters. All STREs residing upstream of gene transcription start sites were organized by k-means clustering (k = 10) on the basis of the nucleosome occupancy profiles over the 1 kb regions centered on STRE at 20 min following the glucose-to-glycerol nutrient downshift. The clustered nucleosome occupancy profiles are presented as a heat map (A). A heat map of the binding profiles of Msn2 at 20 min following the nutrient downshift is shown in (B), with the same gene order as in (A). The average nucleosome and Msn2 occupancy in the 1kb regions centered on STRE elements for each cluster, before and 20 min after the switch, are shown in (C).

