
Figure 2.
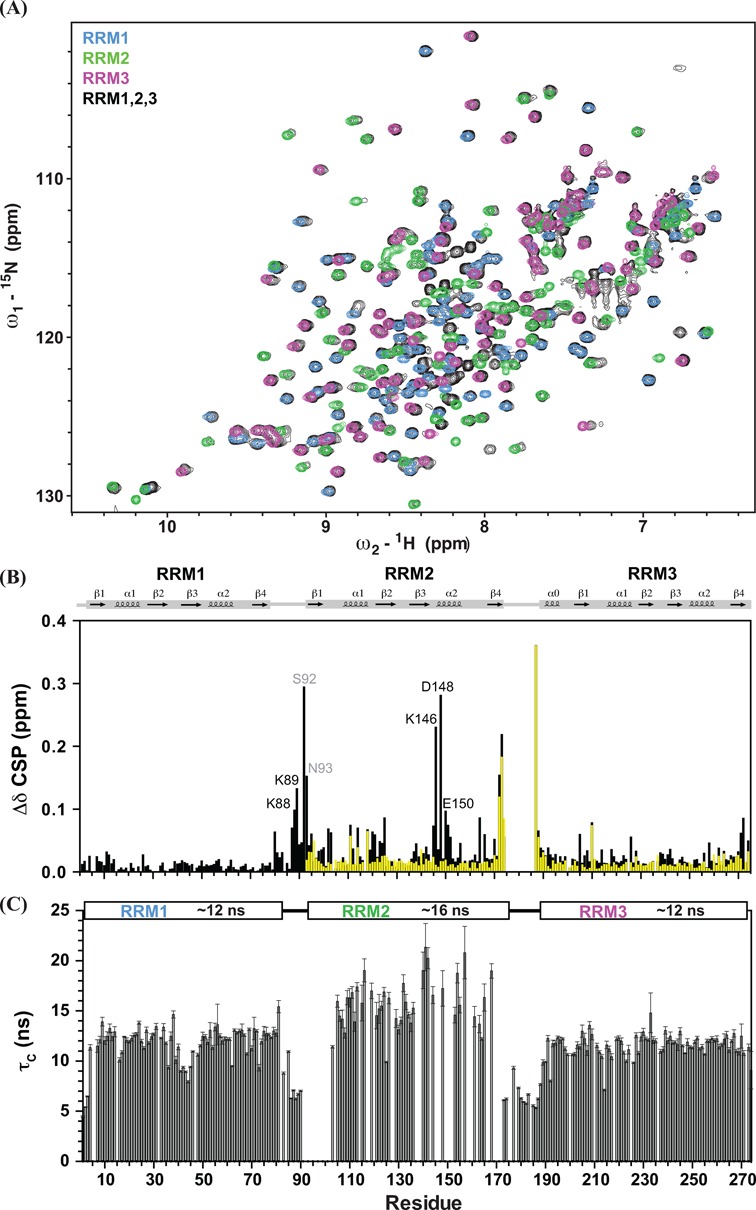
(A) The 1H,15N HSQC NMR spectra of individual RRM1 (blue), RRM2 (green), RRM3 (magenta) and RRM1,2,3 (black) are shown. (B) Differences of chemical shifts of individual RRM with RRM1,2,3 (black) and with RRM2,3 (yellow) are plotted versus residue number. Some distinct differences are observed in the RRM2 helix α2 (Lys146, Asp148 and Glu150) when compared with the resonances of RRM1,2,3. Residues in the RRM1–2 linker (Ser92 and Asn93) and two predicting residues (Lys88 and Lys89) also exhibit large chemical shift differences, suggesting that charge complementary interactions may contribute to the contacts of the RRM1–2 linker and RRM2. (C) Local rotational correlation times (τc) estimated from the ratio of 15N R2/R1 relaxation rates of RRM1,2,3 versus residue number are shown, with average τc values for each RRM domain indicated above. Error bars are derived from the relaxation data.