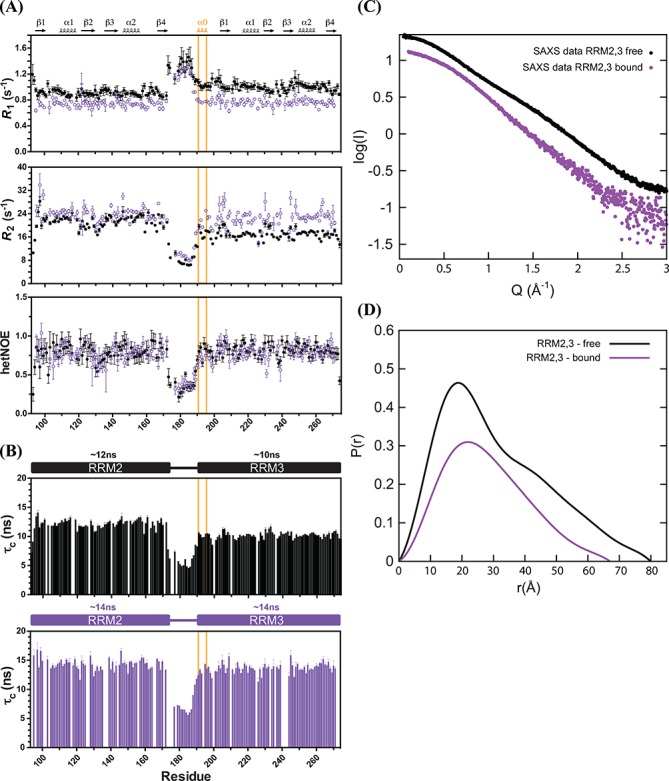
Figure 7.

Relaxation and SAXS data of free and fas_16 RNA bound TIA-1-RRM2,3. (A) R1 (top), R2 (derived from R1ρ, middle) and {1H}-15N heteronuclear NOE values (bottom) of free (closed circles in black) and bound form (open circles in purple) measured at 298 K and pH 6.0 are shown. The average rotational correlation times (τc) for RRM2 and RRM3 in the RRM2,3 protein free (black) and bound to fas_16 (purple) are compared in (B). Residues in RRM3 helix α0 are highlighted with an orange box. (C) SAXS data of TIA-1-RRM2,3 free (black) and bound to fas_16 RNA (purple) and (D) the corresponding pairwise distribution functions.
