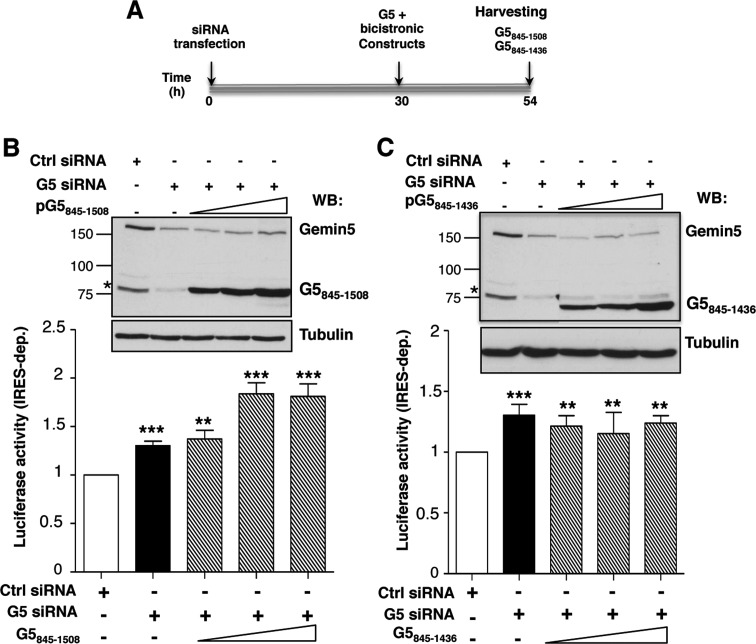
Figure 6.
Effect of G5845–1508 and G5845–1436 polypeptides on IRES activity. (A) Diagram of the silencing and co-transfection assay with indication of harvesting time (h). Effect of expression of G5845–1508 (B) and G5845–1436 (C) on IRES-dependent translation (striped bars) monitor by LUC activity, relative to the values observed in control siRNA treated cells (empty bars). Black bars depict the effect of Gemin5 silencing on IRES-dependent translation. Values represent the mean ± SD (***P < 0.005; **P < 0.01). A Gemin5 WB (top panel) shows the silencing (Gemin5, p170 band) and the expression of the indicated G5 construct separated on 8% SDS-PAGE. Tubulin is used as loading control. Mobility of MW markers is indicated at the left of each WB.

