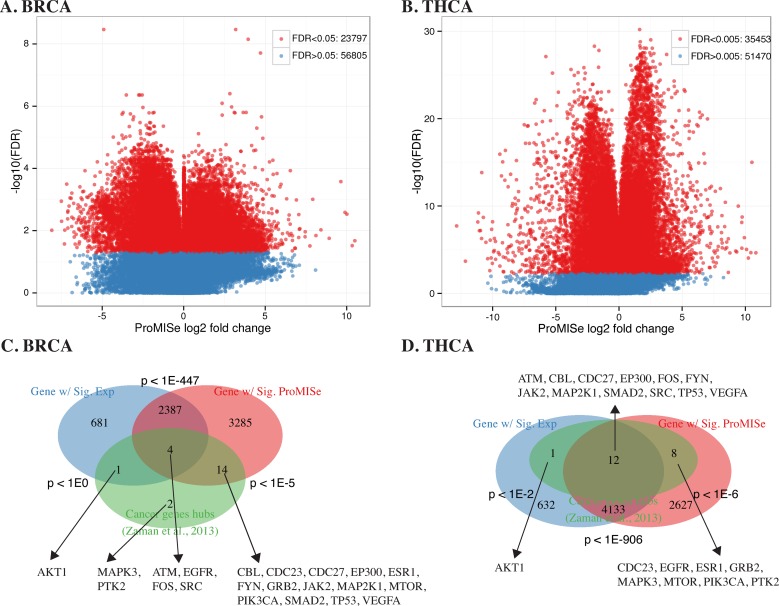
Figure 5.
Paired sample test on matched tumor and normal in BRCA and THCA. (A and B) Volcano plots illustrate the significant interactions with −log 10(FDR) as a function of the averaged ProMISe log2 fold-change in BRCA and THCA tumors, respectively. (C and D) Three-way Venn diagram showing the overlaps among genes with differential expression (blue), genes with differential interactions (red), and putative cancer gene hubs (green) (21), respectively. Hypergeometric p-values are displayed near each pairwise overlap, and the common genes are displayed near the overlap.

