
Figure 4.
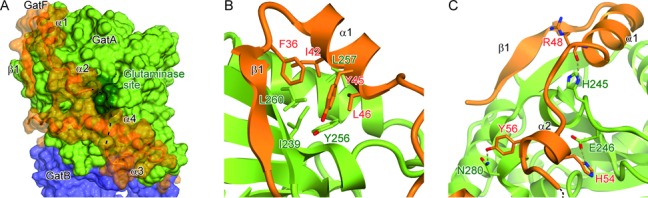
Interface between GatA and the NTD of GatF. GatFAB is colored as in Figure 1. (A) Surface representation of GatFAB. GatF is also shown in a ribbon representation. The glutaminase site is colored dark green. (B and C) Close-up views of the GatF–GatA interface.