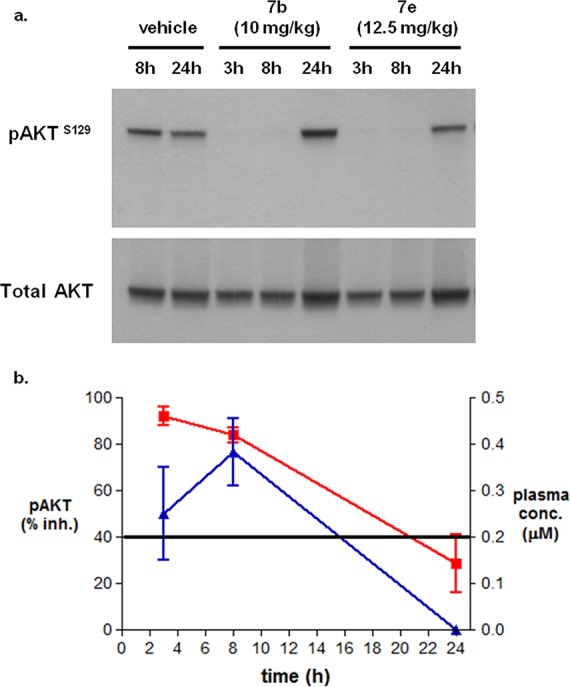
Figure 5.

(a) Western blot analysis of pAKTS129 levels in tumor cell lysates following administration of 7b (10 mg/kg, PO) and 7e (12.5 mg/kg, PO) in a DLD-1 AKT1 overexpressing murine xenograft model. (b) Dose/response plot illustrating pAKTS129 levels (red) in tumor cell lysates, as determined by ELISA, versus plasma concentration of 7b (blue).
