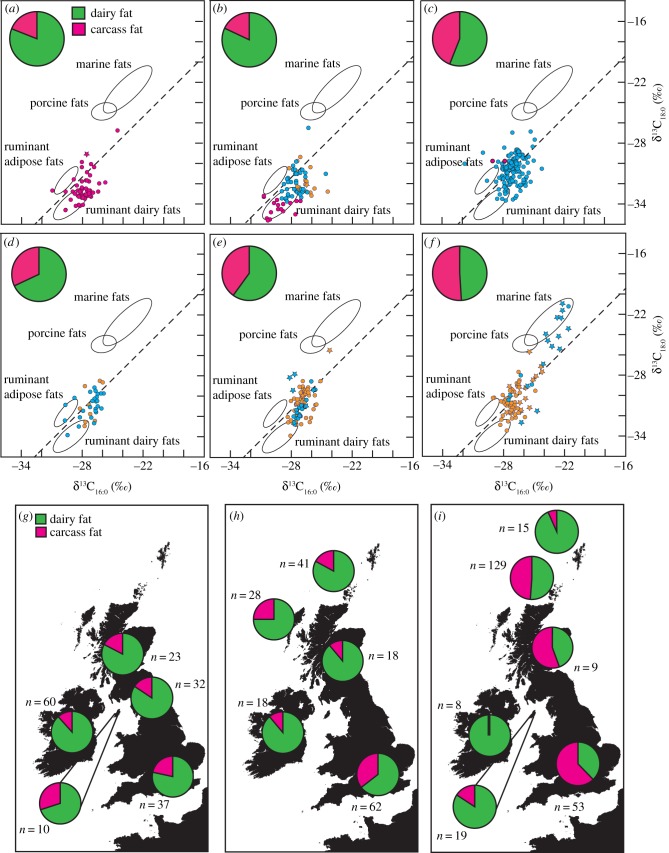
Figure 1.
Prevalence of marine and dairy fats in prehistoric pottery determined from lipid residues. (a–f) Scatter plots show δ13C values determined from C16:0 and C18:0 fatty acids preserved in pottery from northern Britain (red circles), the Outer Hebrides (yellow circles) and the Northern Isles of Scotland (blue circles), dating to (a) Early Neolithic, (b) Mid/Secondary expansion Neolithic, (c) Late Neolithic, (d) Bronze Age, (e) Iron Age and (f) Viking/Norse. Star symbol indicates where aquatic biomarkers were also detected. Ellipses show 1 s.d. confidence ellipses from modern reference terrestrial species from the UK [19] and aquatic species from North Atlantic waters [13]. (g–i) Maps show the frequency of dairy fats in residues from Neolithic pottery from (g) Early Neolithic, (h) the Middle Neolithic/Secondary expansion and (i) Late Neolithic. Additional data from isotopic analysis of residues from Neolithic southern Britain (n = 152) and Scotland (n = 104) are included [19,20].

