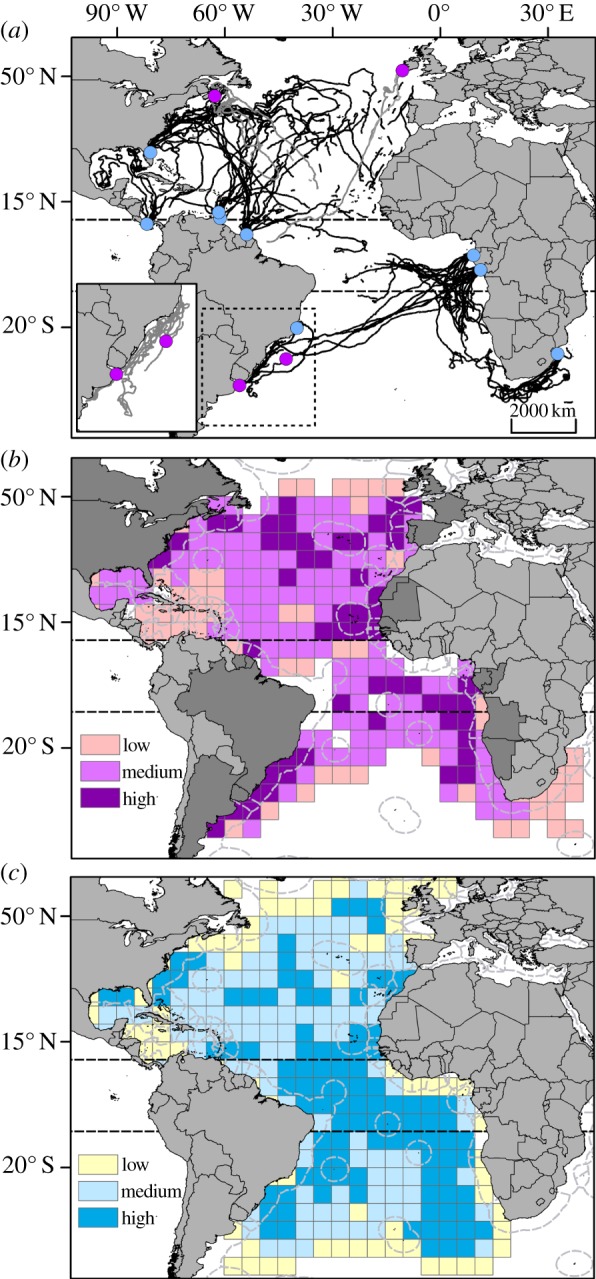
Figure 1.

Movements and density distribution of satellite-tracked leatherbacks and pelagic longline fishing-pressure index in the Atlantic Ocean over 15 years. (a) Movements of satellite-tracked leatherbacks during their migration in the Atlantic Ocean, between 1995 and 2010. Black lines: movements of females tagged on the nesting beach (n = 93). Grey lines: movements of individuals tagged near presumed foraging grounds (n = 13; four males, one juvenile and eight females). Blue dots: deployment from a nesting site. Purple dots: deployment at sea (see the electronic supplementary material, table S1). Inset: movements of six individuals tagged on their foraging grounds in the southwestern Atlantic. (b) Density of leatherback daily locations (locations were time-weighted and population-size-normalized). Three density classes were defined: low, medium and high use. White pixels represent areas from which tracking data were not received. High-use areas occurred both in international waters and within the EEZs of 20 countries (in dark grey) fringing the northern Atlantic (Canada, Cape Verde, Gambia, Guinea Bissau, France/French Guiana, Mauritania, Portugal/Azores, Senegal, Spain/Canaries, Suriname, United States of America, Western Sahara) or the southern Atlantic (Angola, Argentina, Brazil, Congo, Gabon, Namibia, United Kingdom/Ascension Island and Uruguay). Dashed grey lines represent the limits of national EEZs. (c) Fishing-pressure index for the period 1995–2009 in the Atlantic Ocean. This index resulted from the combination of the three fishing-effort classes (see electronic supplementary material, figure S2B) and the three consistency-in-fishing-effort classes (see electronic supplementary material, figure S3B). This index had three levels of increasing intensity (low, medium and high; see Material and methods for more detail). Broken lines represent latitudes 10° N and 10° S.
