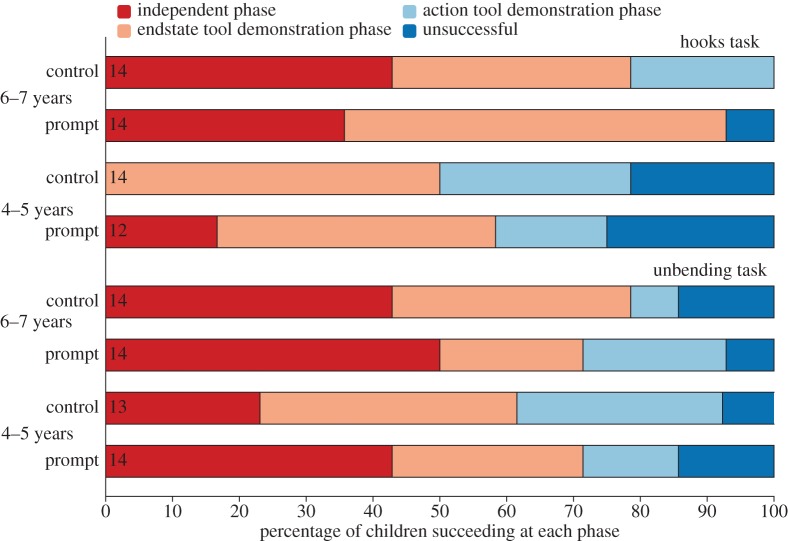
Figure 2.
Perseveration experiment. Percentage of children succeeding at each successive phase of the experiment, and the percentage who were unsuccessful, in each of the age groups and in both the prompt and control conditions. Independent phase = before any tool demonstrations were provided; endstate tool demonstration phase = after children had been shown the required tool endstate; action tool demonstration phase = after a demonstration of the required action to transform the pipecleaner had been provided. Numbers at the base of each bar indicate the number of children in each group. (Online version in colour.)

