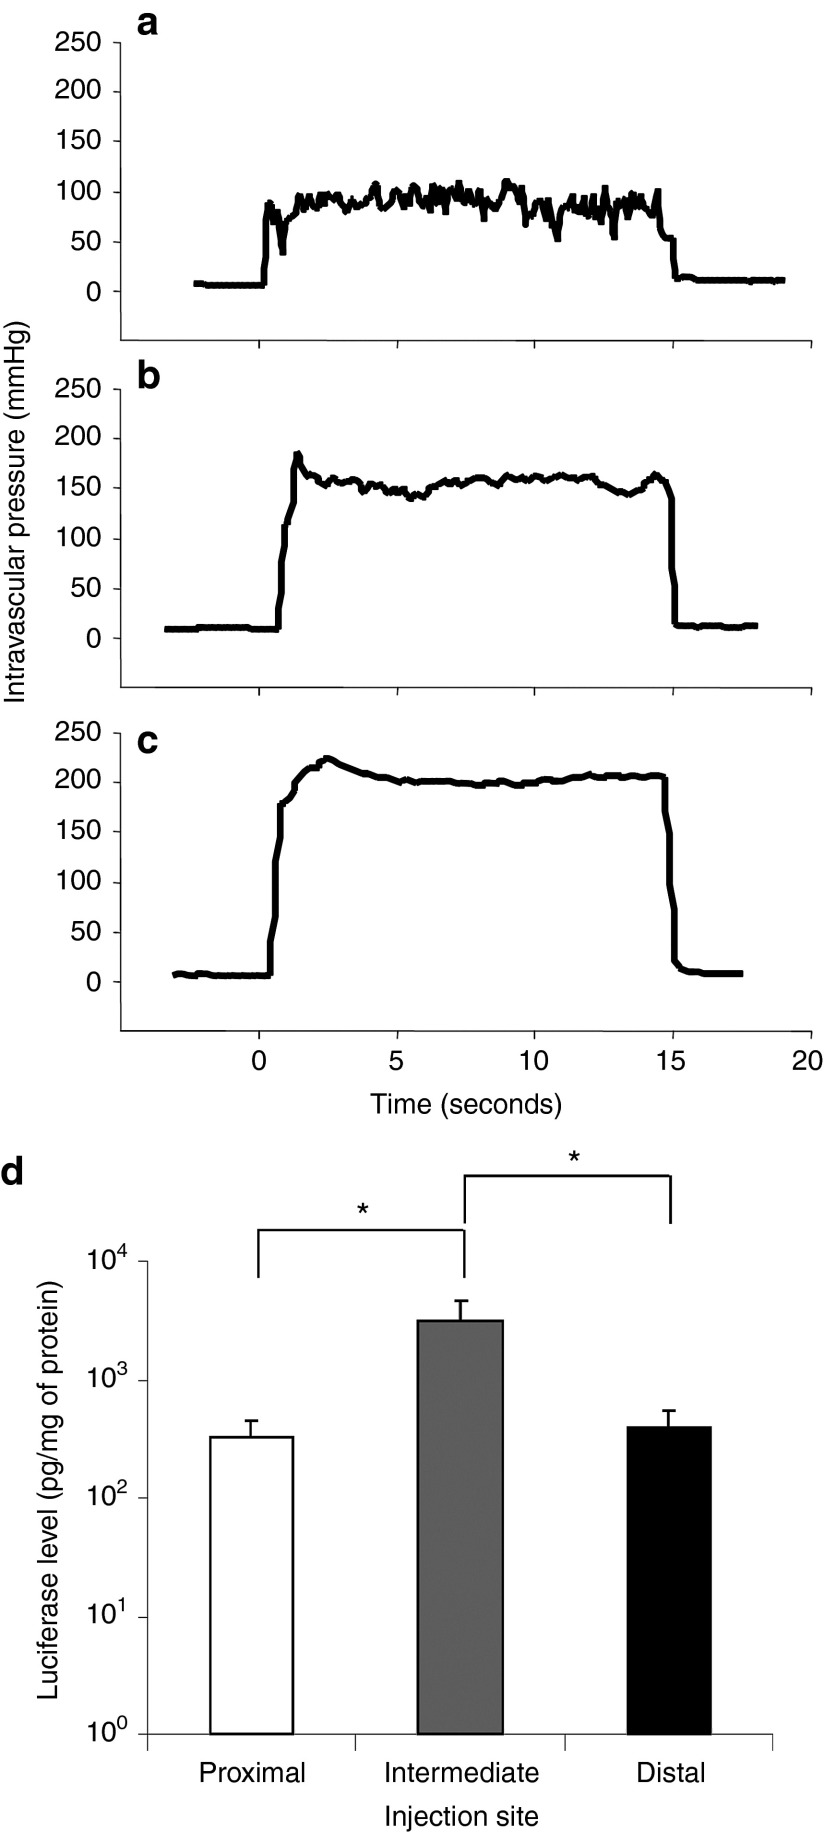
Figure 2.
Effect of injection site on intravascular pressure and level of reporter gene expression. Image-guided hydrodynamic injection of saline-containing pCMV-Luc plasmid (100 µg/ml) was performed from the injection sites shown in Figure 1 at an injection pressure of 300 psi. Intravascular pressure upon the injection from (a) proximal, (b) intermediate, and (c) distal site and average level of luciferase gene expression 24 hours after the hydrodynamic gene delivery in the targeted liver lobe (d). Two pigs were used for each measurement and the average luciferase activity was calculated from 15 liver samples collected from different parts of each targeted liver lobe (n = 30 for each injection site). The values represent mean ± SD. *P < 0.05, one-way ANOVA followed by Bonferroni's multiple comparison test.

