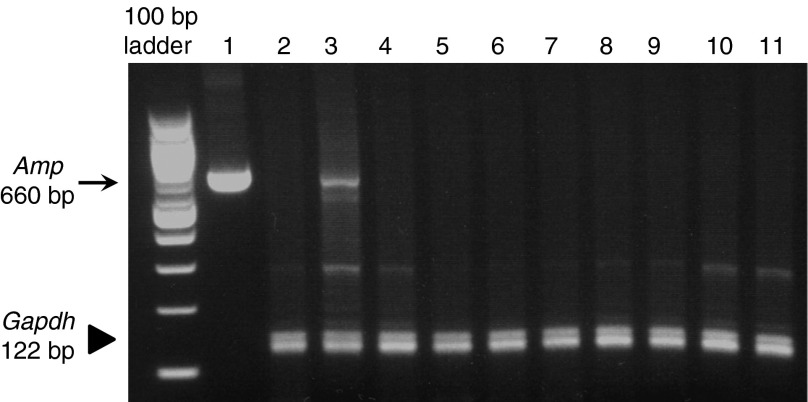
Figure 7.
Tissue distribution of plasmid DNA. Multiplex PCR analysis was performed on genomic DNA collected from pigs by 35 cycles of PCR amplification using primers for ampicillin resistance (Amp) and glyceraldehyde 3-phosphate dehydrogenase (Gapdh) genes, respectively. Lanes: 1, plasmid DNA; 2, normal liver without plasmid injection; 3, injected lobe in pig 2; 4, spleen; 5, kidney; 6, brain; 7, heart; 8, stomach; 9, colon; 10, ovary; 11, lung. The arrow represents the 660 bp Amp fragment. The arrowhead represents the 122 bp Gapdh fragment.

