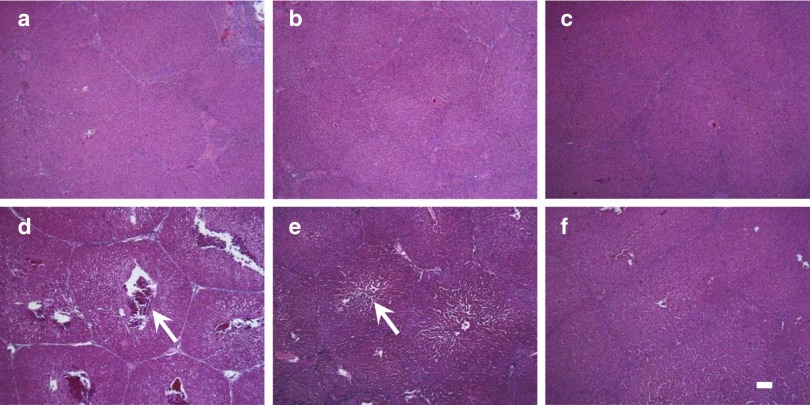
Figure 8.
Assessment of tissue damage by histochemistry. Hematoxylin & eosin staining of liver samples from CL (a–c), and RML (d–f). Samples were collected immediately following the injection (a, d), 4 hours after the injection (b, e), and 24 hours after the injection (c, f). Scale bars represent 100 µm. White arrows represent central vein in the lobular structure.

