Figure 4.

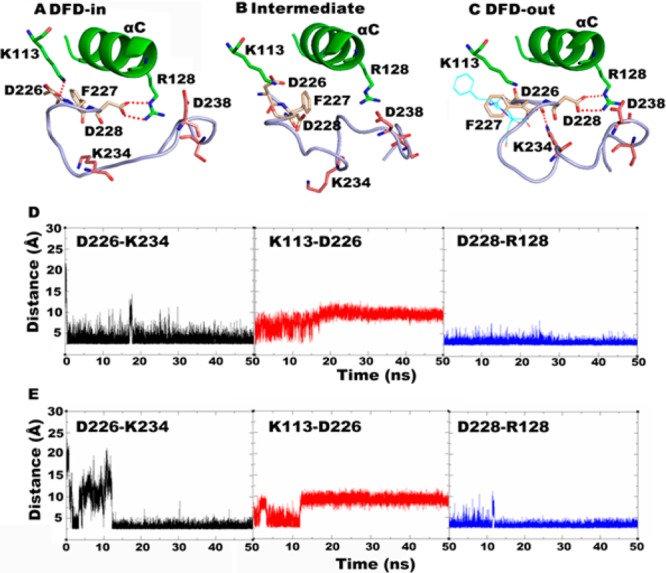
All simulation structures and data shown are taken from the Mnk2-in model. (A) Averaged structure taken from trajectories at 6–10 ns. (B) Snapshot taken from the trajectory at 11.58 ns. (C) Superimposition of initial structure (cyan sticks) and averaged structure taken from the last 4 ns of trajectory time. (D) Interatomic distances for key salt-bridge interactions during the simulation. (E) Interatomic distances for key salt-bridge interactions taken from the repeated simulation. The DFD-motif is shown in yellow sticks; insertion I1 is shown in pink sticks; salt-bridge interactions are shown by red dotted lines.
