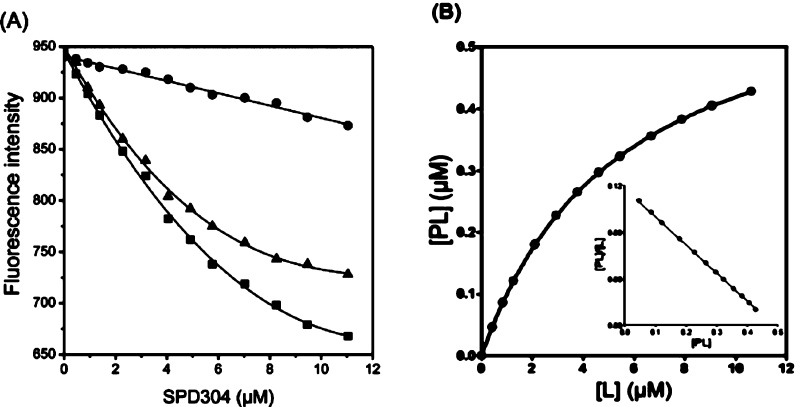
Figure 4.
(A) Dissociation constant (Kd) determination of TNF-α with SPD304. The experiment was performed in 10 mM citrate-phosphate (pH 6.5) containing 5% DMSO. (B) Direct plot of fluorescence intensity against ligand total concentration. Sequential additions of ligand were made into a cuvette containing TNF-α (■) or Tyr (●). The dissociation constant was calculated by fitting the fluorescence intensity corrected values (▲) to a quadratic equation. (B) Saturation plot after calculation of free (L) and bound (PL) ligand concentrations. Inset: Scatchard plots. The mean values of three independent measurements are presented.

