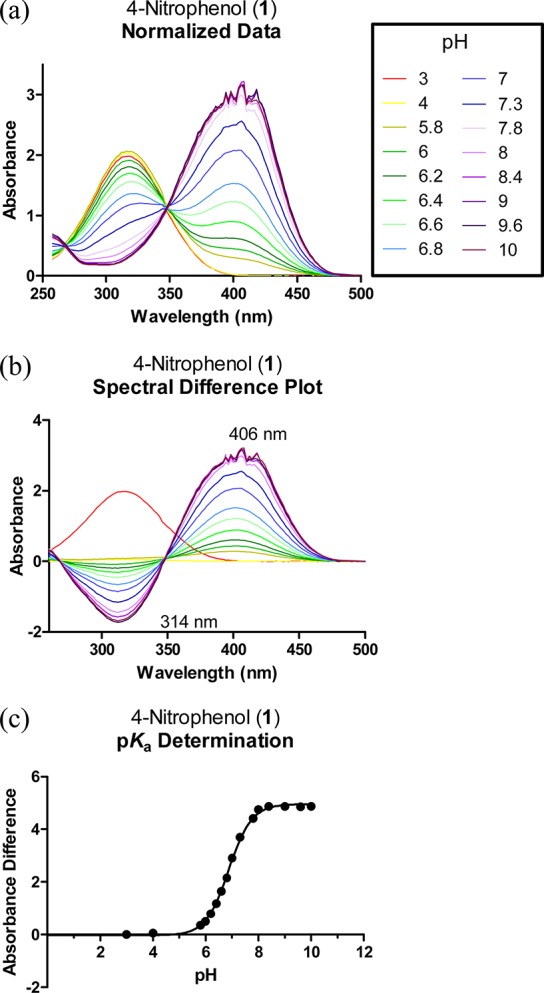
Figure 1.

Spectral data analysis and pKa determination. (a) UV spectrum (λ = 250–500 nm) of 4-nitrophenol (1) in different aqueous buffer solutions ranging from pH 3 to 10. The absorbances are normalized to zero for λ = 500 nm. (b) Plot of the spectral difference between different solutions of 1. The maximum positive deviation occurred at 406 nm, while the maximum negative deviation occurred at 314 nm. (c) Plot of the total absorbance difference vs pH to determine the pKa. The total absorbance difference is the sum of the absolute absorbance difference values at the chosen wavelengths (i.e., 314 and 406 nm). The pKa value was worked out by nonlinear regression using eq 1 according to Tomsho et al. (see the Experimental Procedures).15
