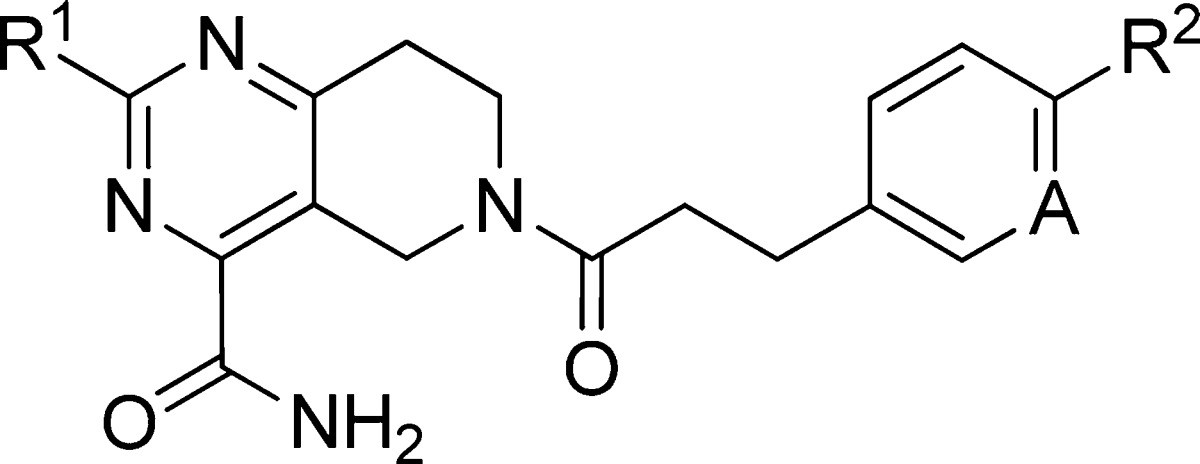
Table 2. Potency and Properties of Selected Analoguesa.

| EC50 (nM)b |
CLintc |
||||||||
|---|---|---|---|---|---|---|---|---|---|
| compd | R1 | R2 | A | induced hTGR5 | uninduced hTGR5 | uninduced dTGR5 | HLM | DLM | eLog D |
| 1 | 166 | 5540 | 4960 | <8.0 | 1.85d | ||||
| 2 | 24 | 316 | 445 | >320 | 3.90 | ||||
| 3 | 154 | 3220 | 2060 | 249 | 5.10 | ||||
| 4 | 47 | 1420 | 584 | >320 | 630 | 2.90 | |||
| 12 | EtNH | H | CH | 257 | 8320 | N.T. | 79 | 1.40 | |
| 13 | EtNH | CH3 | CH | 78 | 3780 | 5800 | 168 | 2.00e | |
| 14 | EtNH | CH2CH3 | CH | 9.2 | 215 | 828 | 238 | 2.40 | |
| 5 | EtNH | CH(CH3)2 | CH | 3.6 | 158 | 213 | >317 | 139 | 3.40 |
| 15 | EtNH | OCH3 | CH | 137 | 2430 | 4280 | 96 | 27 | 1.05 |
| 16 | EtNH | OCF3 | CH | 2.3 | 75 | 135 | 184 | 115 | 3.00 |
| 17 | EtNH | SCF3 | CH | 1.6 | 48 | 112 | >298 | 3.50 | |
| 18 | EtNH | CH2CF3 | CH | 4.7 | 154 | 233 | 141 | 68 | 2.60 |
| 19 | EtNH | CF2CH3 | CH | 2.7 | 146 | 382 | 211 | 2.20 | |
| 20 | EtNH | CF2CH3 | N | 43 | 2990 | 3200 | 18 | 18 | 1.40 |
| 21 | Et | OCF3 | CH | 2.0 | 83 | 220 | 174 | 2.90 | |
| 22 | EtO | OCF3 | CH | 3.3 | 112 | 303 | 115 | 2.90 | |
| 23 | cPr | OCF3 | CH | 2.8 | 43 | 407 | 217 | 3.30 | |
NT, not tested.
Most values are reflective of n ≥ 3 experiments. Please see the Supporting Information for the number of experiments and associated error. All values are for full agonists relative to a standard.
Intrinsic clearance μL/min/mg.
Measured Log D by shake-flask method.
Calculated Log D using a model based on Cubist modeling methodology [Rulequest Research, www.rulequest.com]. The training set for the model was based on >45000 measured eLog D values.24
