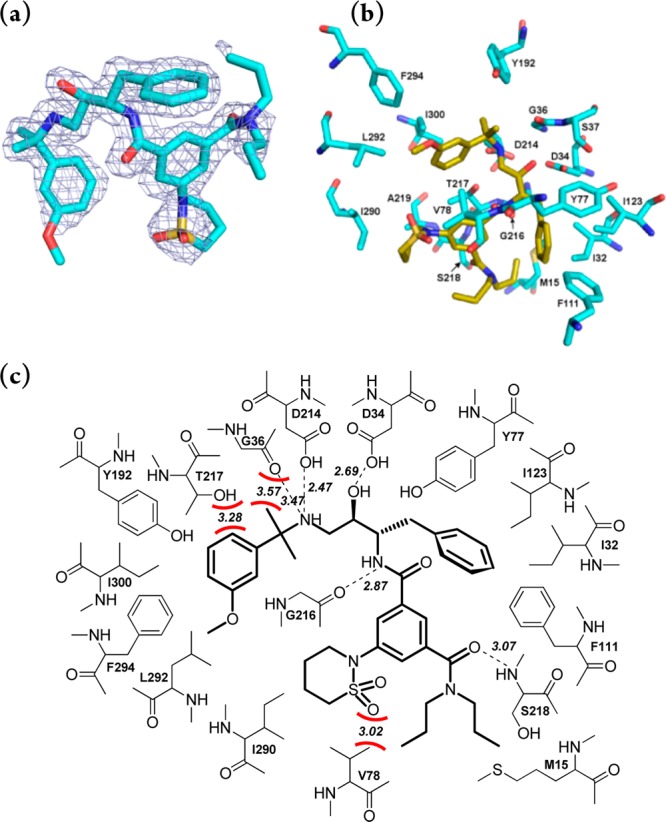
Chart 2. Binding of 1 (TCMDC-134674)6 within the Active Site of Plm IIa.

a (a) X-ray crystal structure showing the ligand and residues located within 4 Å from it as stick models (colored in yellow and cyan, respectively). (b) 2Fo – Fc electron density of the bound ligand contoured at 1σ. The figure was generated using PyMOL.22 (c) Ligand interaction diagram. Hydrogen bonds are shown as dashed lines, and distances between heavy atoms are indicated. Potentially repulsive interactions between the ligand and protein atoms are shown as red curves, and distances between the closest heavy atoms are indicated in Å.
