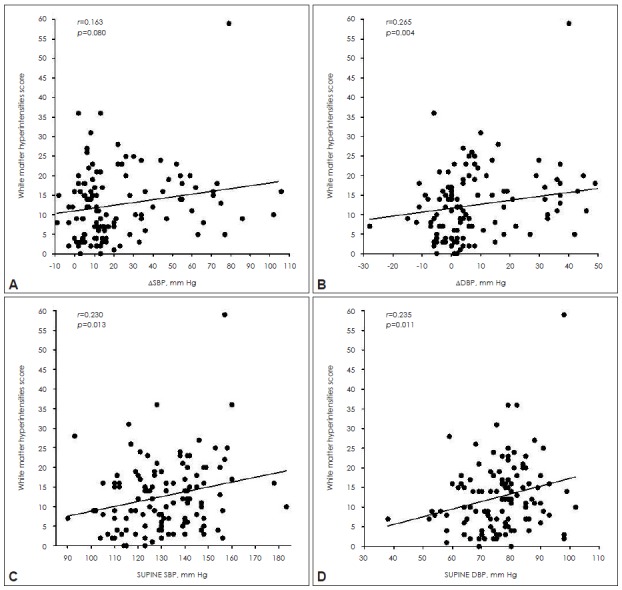
Figure 1..

Scatter diagram of individual orthostatic blood pressure change (A and B) and supine blood pressure (C and D) and in association with white matter hyperintensities scores. The white matter changes were more severe along with orthostatic ΔDBP and supine blood pressure increase in Spearman’s correlation analysis.
