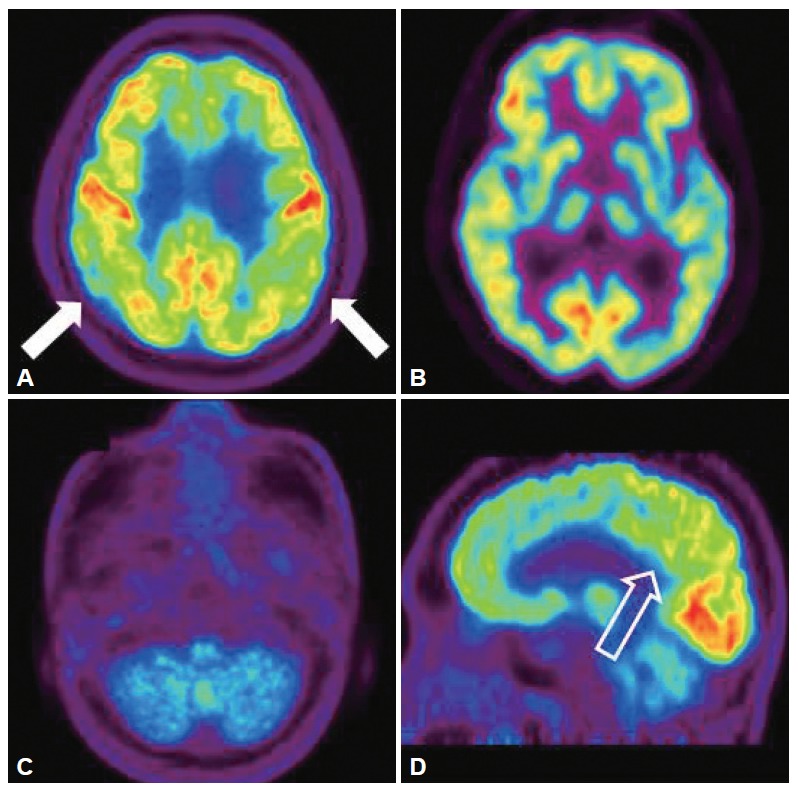
Figure 2.

Brain [18F]-FDG PET images of the patient. Brain [18F]-FDG PET showed mildly decreased FDG uptake in the both posterior parietal lobe (A, white arrow). And also there were markedly decreased FDG uptake in both bagal ganglia and cerebellum (B and C). The sagittal image revealed mildly deceased FDG uptake in posterior cingulated area (D, empty arrow). PET: positron emission tomography, FDG: 18F-fluorodeoxyglucose.
